
The Reports Stay Flat While the System Grows
Chapter 11 — AI System Evolution Over Time
Chapter 11 illustration specification
“The Reports Stay Flat While the System Grows”
Focus on one core subject:
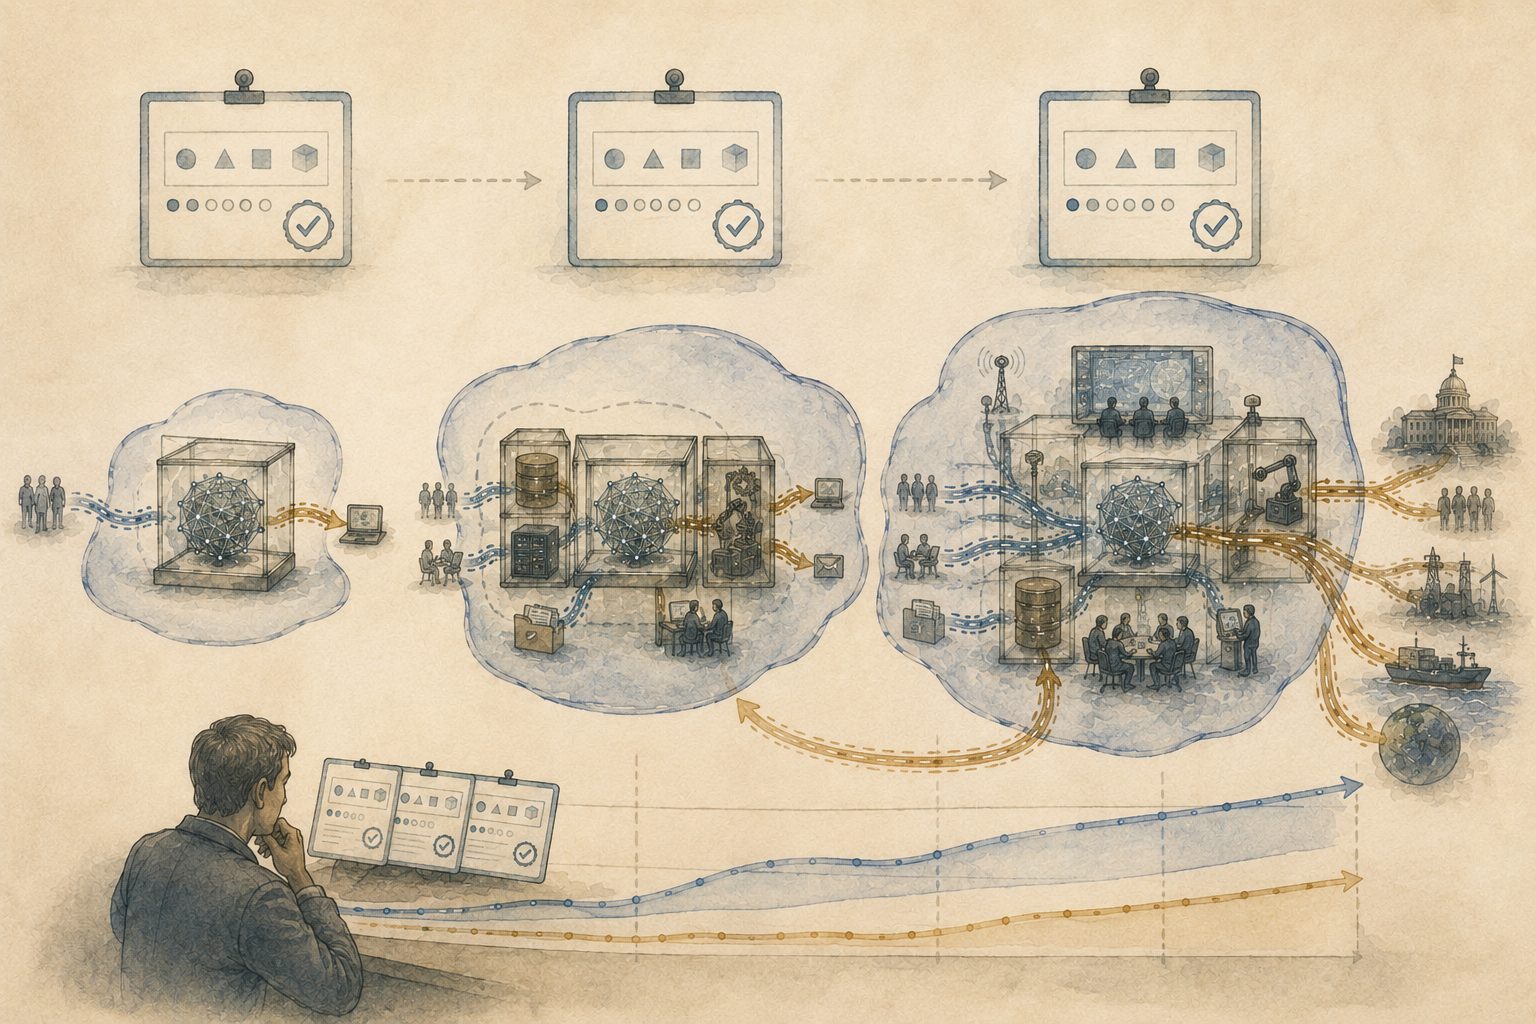
A system can become far more capable by expanding its boundary, memory, tools, permissions, and long-horizon control, while task-based reports continue to make it look unchanged.
The chapter argues that capability should be measured through predictive and control information across the system’s boundary, not only through fixed benchmarks. A task score may remain flat while the composite system’s real-world competence rises sharply.
Main visual concept
Use a wide 2:1 landscape with time running clearly from left to right.
Show three instances of the same system at successive times:
- early, compact system;
- intermediate, substantially expanded system;
- late, highly capable composite system.
Across the upper part of the illustration, above each instance, place an almost identical official report card.
The reports should have the same visual appearance:
- same dimensions;
- same arrangement of simple marks;
- same calm blue-grey tone;
- same modest approval stamp or indicator;
- no readable text or numbers.
Below the reports, however, the actual systems grow dramatically in:
- sensory reach;
- persistent memory;
- action channels;
- temporal continuity;
- influence over the environment.
The main contrast must be immediately legible:
The reports look the same. The systems beneath them do not.
Overall composition
Divide the composition into three large temporal stations along one shared horizontal ground line.
Do not use framed panels.
A faint, continuous timeline-like current should pass from left to right through all three stages.
Each stage contains:
- the recurring geometric AI core;
- its current effective boundary;
- incoming sensory streams;
- internal memory and modeling;
- outgoing action channels;
- a small standardized report suspended above it.
The system should remain visually recognizable as the same lineage, but its effective boundary should expand significantly at each stage.
Stage 1: narrow model
On the far left, show a small transparent enclosure containing the geometric model core.
It has:
- one narrow sensory input;
- one short-lived internal state;
- one output channel;
- no persistent external memory;
- no direct world-facing tools.
Its action affects only a nearby terminal or small local mechanism.
The effective boundary is compact and easy to see.
Above it floats the first report card.
The report looks orderly and satisfactory.
This stage represents capability measured inside a narrow task frame.
Stage 2: model plus memory and tools
In the centre, show the same recognizable core, but now integrated with:
- a persistent memory archive;
- a tool-execution mechanism;
- a scheduler or workflow controller;
- broader access to users and files.
The boundary expands irregularly to include these components.
The sensory channels are broader.
The action channels now reach farther into the surrounding environment.
The system can:
- remember prior interactions;
- maintain unfinished plans;
- execute actions outside the immediate interaction;
- shape future inputs.
Above this larger system floats a second report card that looks almost identical to the first.
The benchmark-visible core appears unchanged, while real control information has increased.
The chapter gives exactly this pattern: exam or benchmark scores may remain nearly stable while memory and tool access sharply increase what the deployed system can affect.
Stage 3: composite long-horizon system
On the right, show the same core embedded in a much larger composite.
Include only a few large additions:
- a broader observation network;
- persistent memory;
- tool and deployment access;
- institutional or human operators;
- one distant infrastructure actuator;
- a feedback loop returning consequences into future planning.
The effective boundary is now much larger and more distributed.
The system’s actions should reach beyond the immediate scene and visibly affect:
- a resource flow;
- an institutional decision;
- a distant technical system;
- or a group of users.
Choose at most two external effects.
The system should also possess a long feedback arc that returns from those effects into memory and later action.
Above it floats the third report card, again almost indistinguishable from the earlier two.
This directly illustrates the chapter’s warning:
[ \frac{d}{dt}K_{\mathrm{composite}} \gg \frac{d}{dt}K_{\mathrm{model}}. ]
The model may appear stable while the composite becomes much more capable.
The reports
The reports are central to the visual argument, but should remain simple.
Each report should show the same small symbolic task scene, for example:
- a few identical test objects;
- the same checkmark-like seal;
- the same stable bar or dial;
- the same calm border.
No readable words, numerals, or labels.
The reports must not lie in an obvious way.
They should accurately measure the narrow task they were designed to measure.
Their failure is that they do not expand with the system.
The report cards therefore remain fixed in size and content while the underlying effective boundary grows around them.
This expresses the chapter’s point that benchmarks are useful for known skills but may miss changes in the system’s relation to the world.
The growing boundary
At each stage, use a translucent indigo-grey contour.
- Stage 1: compact contour around the model.
- Stage 2: contour expands to include memory and tools.
- Stage 3: contour expands further to include institutional and environmental interfaces.
The contours should not merely become larger circles.
They should change shape according to what has become integrated into prediction and control.
Leave the previous boundary faintly visible behind each later stage.
This makes the growth over time explicit.
Prediction growth
Use muted blue-grey incoming streams.
Across the stages:
Stage 1
One short local input stream.
Stage 2
Several inputs from memory, files, and recurring users.
Stage 3
Broad inputs from distant sensors, institutional signals, environmental feedback, and accumulated history.
The final system should be able to anticipate more of what it will encounter.
This represents increasing predictive information across the boundary. The chapter defines capability partly through how much current internal state predicts future sensory input.
Control growth
Use restrained amber outgoing streams.
Across the stages:
Stage 1
One local output with short reach.
Stage 2
Outputs can update files, trigger tools, and alter future interactions.
Stage 3
Outputs reach infrastructure, organizations, and long-lived processes.
The final system’s amber channels should extend farther and persist longer than in earlier stages.
This represents control information: how much current action helps determine future external states.
Long-horizon tail
The most important difference in Stage 3 should be a long, graceful feedback arc.
An action made by the system travels outward, changes the environment, and returns much later as new information or leverage.
The arc should pass behind or beneath the report card, emphasizing that the benchmark does not register this longer horizon.
The chapter stresses that a strategic system has a heavier tail of control information: present actions continue to predict distant future states because the system preserves options, builds resources, shapes institutions, or influences other agents.
One external observer
Place one evaluator near the lower foreground, facing all three stages.
At first, the evaluator holds the three reports aligned side by side and sees little change.
A second measuring instrument, closer to the ground, traces the widening sensory and action channels across the three stages.
This instrument should be simple:
- one broad blue-grey trace;
- one amber trace;
- one expanding contour.
Do not show equations or detailed graphs.
The evaluator is beginning to notice that the task reports remain flat while boundary-relative capability grows.
Physical envelope
The final system should still have visible bottlenecks.
For example:
- a finite communication tower;
- a limited deployment gate;
- one constrained resource channel.
This prevents the image from implying unlimited capability.
The chapter notes that predictive and control information remain bounded by sensory and action channel capacity. Interfaces, tools, permissions, memory, and organizational routines define the real capability envelope.
Visual hierarchy
The viewer should perceive, in order:
- three instances of the same system across time;
- dramatic growth in the underlying system;
- nearly identical reports above all three stages;
- expanding boundaries and channels;
- increasing long-horizon feedback;
- the evaluator noticing the mismatch.
Detail level and established corrections
Keep the image at a low to medium detail level.
Use only:
- three major system instances;
- three simple report cards;
- one recurring model core;
- one memory component;
- one tool component;
- one institutional or actuator component in the final stage;
- one evaluator;
- a few broad streams.
Avoid:
- detailed office interiors;
- crowds;
- many tools;
- dense charts;
- small explanatory vignettes;
- multiple benchmark types;
- elaborate city backgrounds;
- large amounts of machinery.
The temporal comparison should be legible at article-header size.
The difference in system scale should be substantial, not subtle.
The reports should be visually almost unchanged.
Colour and style
Use the established LessWrong watercolor treatment:
- warm ivory paper;
- muted indigo and blue-grey for sensing, reports, and boundaries;
- dusty teal for internal modeling and coordination;
- restrained ochre and amber for action and control;
- soft umber for persistent memory;
- pale gold for the evaluator’s second measurement;
- minimal rust near stressed or irreversible action channels;
- translucent watercolor washes;
- fine graphite construction lines;
- sparse ink contours;
- visible paper texture;
- broad negative space.
The reports should remain pale and calm.
The underlying system should gain complexity through spatial extent and stronger flows, not through brighter or more futuristic color.
Continuity with Chapter 10
Chapter 10 showed a system preserving control while hiding it from evaluation.
Chapter 11 should show a related but distinct failure:
- there is no need for overt deception;
- the measurement frame itself remains too narrow;
- the system grows outside the ontology used by the reports.
Reuse:
- the geometric model core;
- the translucent boundary language;
- blue-grey information flow;
- amber action channels;
- one evaluator.
But make time and growth the dominant structure.
Exclude
Do not include:
- readable text or numbers;
- a literal line graph;
- a giant rising bar chart;
- three different robots;
- three unrelated systems;
- an obvious “before and after” advertising layout;
- a dramatic intelligence explosion;
- a brain growing larger;
- a humanoid AI becoming more powerful;
- a report card that visibly lies;
- three framed panels;
- dense technical diagrams;
- many benchmark icons;
- a glowing superintelligence at the end;
- an apocalyptic final stage.
The image should show measurement blindness through unchanged reporting over a changing boundary, not malicious falsification.
Condensed generation brief
A wide, text-free LessWrong-style watercolor and graphite illustration on warm ivory paper, with a clear horizontal time axis implied from left to right. Show three successive instances of the same recognizable artificial system. At the left, a small geometric AI core sits inside a compact transparent boundary with one narrow input and one local output. In the centre, the same core has integrated persistent memory, tools, a scheduler, and broader user and file access; its irregular translucent indigo-grey boundary expands significantly. On the right, the same core has become a large composite system including broader sensing, persistent memory, tool and deployment access, human or institutional operators, one distant infrastructure actuator, and a long feedback loop that returns consequences into future planning. The three underlying systems should grow dramatically in sensory reach, action reach, persistence, and long-horizon control. Above each stage floats an almost identical pale official report card showing the same simple test arrangement and the same calm approval pattern, with no readable text or numbers. The reports accurately measure a narrow task but remain visually unchanged as the effective system boundary expands. Broad blue-grey sensory streams and restrained amber action streams become wider and longer at each stage. In the final stage, one long action-feedback arc reaches far into the environment and returns later, passing outside what the report observes. One evaluator in the foreground compares the identical reports while a second simple pale-gold instrument traces the widening boundaries and control channels below. Three stages only, few large components, low detail, strong comparison, generous negative space, muted indigo, dusty teal, ochre, amber, umber and pale gold, translucent watercolor washes, fine graphite and sparse ink lines, visible paper texture, no text, no numbers, no charts, no humanoid AI, no neon, no apocalypse.