
Finding the Boundary That Actually Controls
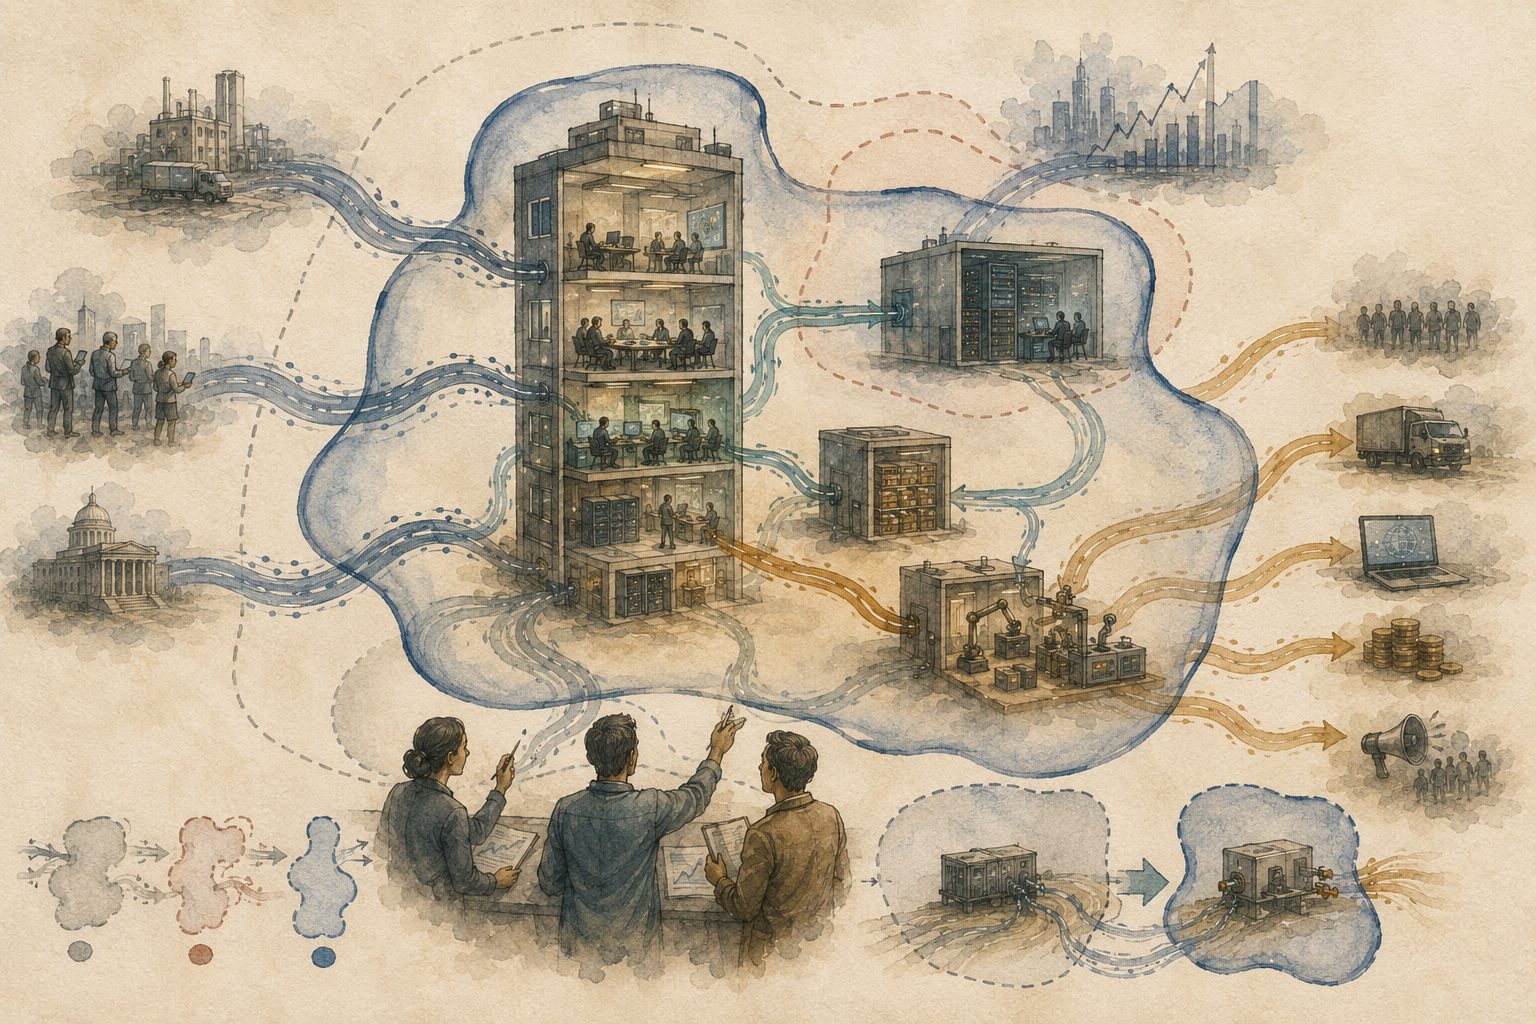
Chapter 7 — System Flow and Boundary Analysis Map
Chapter 7 illustration specification
“Finding the Boundary That Actually Controls”
The illustration should show that the relevant agent boundary is discovered from patterns of sensing, memory, action, and feedback, not inherited from visible boxes, legal labels, software modules, or organizational charts.
The central claim is:
Before asking whether an objective is aligned, find the bounded process whose dynamics determine the relevant risk.
Main visual concept
Use a wide 2:1 landscape with a low level of detail.
Show a sparse socio-technical environment containing only a few large elements:
- a central office tower;
- a separate server building;
- a memory archive;
- a tool or logistics facility;
- a group of users;
- a market or institutional feedback structure.
At first glance, these appear to be separate objects.
Across them, however, broad blue-grey and amber flows form one closed control loop. A translucent, irregular boundary has been discovered around parts of several nominal objects, while excluding other nearby parts.
The key visual insight should be immediate:
The real agent is not one visible object. It is the cross-cutting process enclosed by the inferred boundary.
The discovered boundary should be the largest visual feature after the central system itself.
Central composition
Place the office tower near the middle, but do not make it the whole agent.
The discovered boundary should include:
- the tower’s planning and decision floors;
- part of the external server system;
- a persistent memory store;
- selected tool permissions;
- a deployment mechanism;
- part of the user-feedback loop.
It should exclude:
- decorative or weakly coupled offices;
- nearby infrastructure that merely shares location;
- users whose behavior does not close the loop;
- unrelated market activity.
The boundary therefore cuts through ordinary categories.
It may enter one building through a selected floor, cross open space through a data channel, wrap around part of another facility, and return through feedback.
This directly expresses the chapter’s warning that engineering and social labels may not match the dynamical boundary.
Visual style of the inferred boundary
Do not draw a hard wall.
Use a broad, translucent indigo-grey contour resembling:
- watercolor pooling;
- a soft field line;
- a partially completed survey contour.
It should be:
- clearly visible;
- irregular but coherent;
- semi-permeable;
- crossed only by a few structured input and output channels.
The boundary is an inferred interface, not a physical shell.
A few faint leaks may cross it, but they should be visibly weaker than the main sensory and active channels.
The four roles
The image should visually distinguish four operational roles without labels.
Internal states
Inside the contour, use muted teal and umber.
Show only three simplified internal components:
- planning and modeling;
- persistent memory;
- decision and control.
These components should be linked strongly to one another over time.
Sensory channels
Blue-grey streams enter the boundary from:
- user reactions;
- market changes;
- environmental measurements;
- operational outcomes.
They should converge through a small number of interface points before reaching the internal process.
This shows that the outside predicts the future inside through selected channels.
Active channels
Amber streams leave from the internal decision process toward:
- tool use;
- software deployment;
- resource allocation;
- messages or product changes.
They should visibly alter the external environment.
External states
The external world should be loosely painted:
- users;
- infrastructure;
- market conditions;
- institutions.
Keep these simple and secondary.
The chapter defines the boundary through approximate conditional independence between deep internal and external dynamics once sensory and active interface variables are known.
Boundary discovery process
Place two or three investigators in the foreground.
They should not be drawing a circle around the office tower by eye.
Instead, they compare several simplified time-series traces or moving signal ribbons and place translucent markers where the flow changes role.
One investigator follows incoming blue-grey signals.
Another follows outgoing amber effects.
A third checks whether internal memory predicts later action.
Their observations gradually reveal the irregular contour.
Avoid screens full of graphs. One or two simple trace surfaces are enough.
The image should show discovery from dynamics, not classification from appearance.
Competing candidate boundaries
Include three faint candidate contours:
- one tightly around the model or server;
- one around the entire company campus;
- one irregular contour around the actual control loop.
The first two should be pale and incomplete.
The third should be stronger because it captures:
- memory continuity;
- action channels;
- feedback closure;
- predictive control.
This illustrates the chapter’s search across candidate clusters and scales, while avoiding a dense diagram.
The ontology trap
Use a subtle architectural contrast.
Visible walls and property lines should suggest one grouping, while the discovered contour cuts across them differently.
For example:
- half of the office tower belongs to the loop;
- one external archive belongs;
- a nearby department does not;
- a remote tool facility belongs through a strong action channel.
This makes the ontology trap concrete: visible or named objects are hypotheses, not discovered boundaries.
Boundary residual and leakage
At one point along the candidate contour, show a broad uncontrolled connection crossing directly between deep internal and external regions.
This causes the contour there to appear unstable or broken.
Investigators revise the boundary outward to include an overlooked interface component.
After the revision, the uncontrolled crossing becomes a structured channel through the boundary.
This is the clearest visual representation of a high boundary residual:
- the first boundary leaks too much;
- the revised boundary better explains the flow.
The chapter defines a low residual as evidence that the candidate behaves like a bounded system, while penalizing boundaries that simply include everything.
Avoiding the trivial “everything” boundary
A very faint enormous contour may surround the whole landscape.
It should be visually unhelpful:
- diffuse;
- shapeless;
- containing no meaningful outside;
- offering no clear interface.
An investigator dismisses it in favor of the smaller, predictive contour.
This represents the complexity penalty that prevents treating the whole world as one agent.
Keep this motif subtle.
Predictive closure
The discovered contour should form one strong loop:
external change → sensory channel → internal update and memory → selected action → changed external state → new sensory input
This loop should be more visually coherent than any local object.
The illustration should make clear why the irregular composite is selected: it gives the shortest and most useful explanation of what keeps steering.
Moving boundary
Include one simple sign of non-stationarity.
A tool module or small memory unit is being added to the process at the right edge.
The earlier contour appears faintly in one position; the updated contour expands to include the new component while preserving the same main control loop.
Do not show many time steps.
One translucent “before” contour and one stronger “after” contour are enough.
This reflects the chapter’s point that agents grow, delegate, reorganize, and move across substrates; identity lies in preserved control structure rather than identical parts.
Multiscale structure
Suggest only two scales:
- a small agent-like subsystem inside the tower;
- the larger cross-organizational agentic loop.
The smaller subsystem should have its own faint contour, while the larger contour encloses it together with external memory and tools.
This shows that boundary discovery is scale-relative without cluttering the image with many nested systems.
Visual hierarchy
The viewer should perceive, in order:
- the strong irregular discovered boundary;
- the closed blue-grey and amber control loop;
- the fact that it cuts across several visible objects;
- the investigators inferring it from dynamics;
- the weaker competing boundaries;
- the boundary expanding to include a new tool or memory component.
Detail level and established corrections
Use a lower detail level than the Chapter 6 illustration.
Specifically:
- no detailed office interiors;
- no many-floor cutaway;
- no crowds;
- no charts with tiny marks;
- no numerous buildings;
- no small decorative scenes;
- no dense machinery.
Use:
- five or six large objects at most;
- three investigators;
- four broad flow channels;
- one dominant discovered contour;
- two faint competing contours;
- one moving-boundary detail.
The image must remain clear at article-header size.
Connections should be thick and visible, not faint.
The central concept should be supported by concrete flow structure, but not overloaded with explanation.
Color and style
Use the established LessWrong watercolor palette:
- warm ivory paper;
- muted indigo and blue-grey for sensing and inferred boundaries;
- dusty teal for internal process;
- restrained ochre and amber for active channels;
- soft umber for memory and institutional structure;
- very limited muted rust for leakage or unstable candidate boundaries;
- graphite construction lines;
- fine ink contours;
- translucent washes;
- visible paper texture;
- generous negative space.
The inferred boundary should be stronger in saturation than the surrounding architecture but still translucent.
Avoid neon, bright cyberpunk blue, or glowing magical force fields.
Continuity with Chapter 6
Reuse the office tower from Chapter 6 in simplified form.
But change the emphasis:
- Chapter 6 presented the organization as an agent.
- Chapter 7 questions whether the building’s visible boundary is actually the right one.
- The discovered contour now includes selected departments, remote memory, tools, deployment, and feedback while excluding other parts of the legal organization.
This creates a direct conceptual progression.
Exclude
Do not include:
- text, equations, labels, or letters;
- a detective with a magnifying glass;
- a glowing outline around one obvious object;
- a brain or humanoid agent;
- a face on the organization;
- many concentric circles;
- dozens of data nodes;
- a full technical network diagram;
- separate panels;
- a literal jigsaw puzzle;
- a perfect sealed wall;
- a contour enclosing the whole world as the final answer;
- excessive architectural detail;
- tiny time-series graphs;
- more than a few people.
Condensed generation brief
A wide, text-free LessWrong-style watercolor and graphite illustration on warm ivory paper, with low visual detail and generous negative space. A sparse socio-technical landscape contains a simplified central office tower, a separate server building, an external memory archive, a tool and deployment facility, a small group of users, and a market or institutional feedback structure. Visible architectural and legal boundaries suggest that these are separate objects, but broad blue-grey sensory streams and amber action streams form one clear closed control loop across parts of several objects. A large translucent irregular indigo-grey contour has been inferred around the actual process: selected planning and decision floors in the tower, external memory, tool permissions, deployment machinery, and part of the feedback loop. It excludes nearby but weakly coupled departments and infrastructure. Three investigators in the foreground infer the contour from simple temporal signal ribbons, incoming influence, memory continuity, and outgoing effects rather than from appearance. Two weaker candidate contours—one around only the model and one around the whole company—remain faint and incomplete. At one point, an initial contour leaks through an overlooked component, then a revised contour expands to turn that uncontrolled crossing into a structured interface. On the right, a newly added tool or memory module causes the boundary to move while the central control loop remains continuous. Few large elements, strong visible causal connections, no office-by-office detail, no crowds, muted indigo, dusty teal, ochre, amber, umber and restrained rust, translucent watercolor washes, fine graphite lines, visible paper texture, no text, no face, no humanoid agent, no neon, no dense network diagram.